How to navigate to this page> Typical display>
rostrvm Manager provides the option to create new custom reports by either adjusting one of the default pre-defined reports or creating your own new one from scratch. This section introduces the user on how to do this although it is recommended that appropriate training is sought from Rostrvm Solutions Ltd before attempting to do so.
All Reports are made up of one or more Panels. The information shown on a panel is extracted from the database through a SQL query. The data to be retrieved by the panel SQL query can be controlled through the use of report Parameters.
Reports Panel
Shows a list of all your reports grouped by the menu on which they appear.
| • | Report - the name of the report; |
| • | Description - a description of the report. |
From here you can:
| • | Create - click the Create button on the Reports panel to add a new entry; |
| • | Modify - click on the report name to change the properties of an existing entry; |
| • | Wallboard - click on this button to display the report as a sequence of wallboard type displays. |
Panel Queries Panel
Shows a list of all your panel SQL queries grouped by the report on which they appear.
| • | Query - the name of the query; |
| • | Report - the report on which it appears. |
From here you can:
| • | Check Query - click this button to check that this and all other panel SQL queries are valid; |
| • | Modify - click on the panel query name to change the properties of an existing entry. |
Report Parameters Panel
Shows a list of all the available report parameters.
| • | Report Parameter - the name of the report parameter; |
| • | Group - the group (menu) to which the report parameter is associated. |
From here you can:
| • | Create - click the Create button on the Report Parameters panel to add a new entry; |
| • | Modify - click on the parameter name to change the properties of an existing entry. |
Example Custom Report
This example gives you some basic ideas and an introduction to the concepts involved in custom Manager report creation. It is far from an exhaustive definition of what can be achieved. It is strongly recommended that before making significant changes to custom reports, or creating more complex custom reports, appropriate training is sought from Rostrvm Solutions.
What are we going to do?
Let us consider creating a simple custom report. For an individual agent we want to see how long they spent in each agent state, and how many calls they handled for a given time period. We could copy a similar report and edit the panel (SQL query) contents to suit our needs, but for the purposes of this exercise we will create and build it up from scratch.
Create our new report
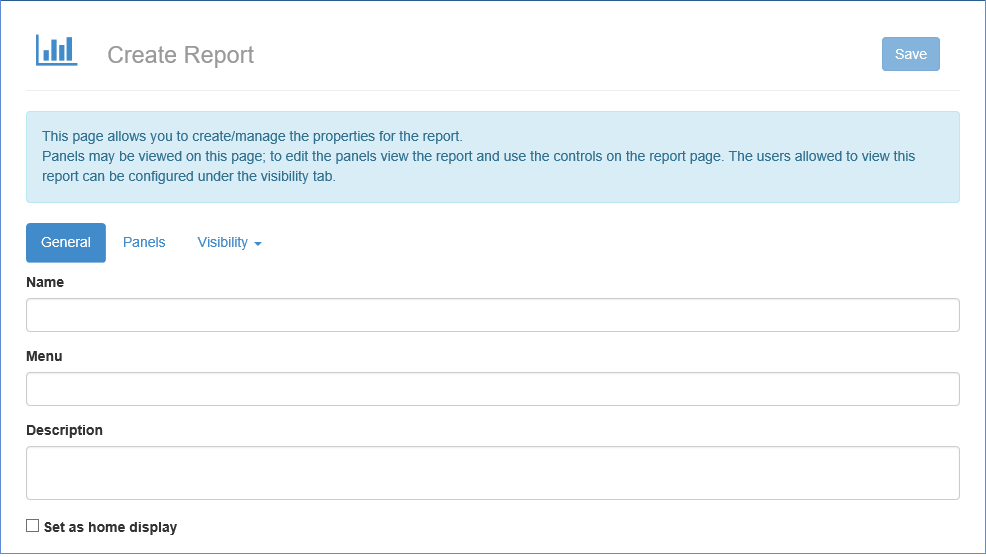
From the Reports pane of the Manage Reports page click on the Create button and enter the report Name and Description on the Create Report page:
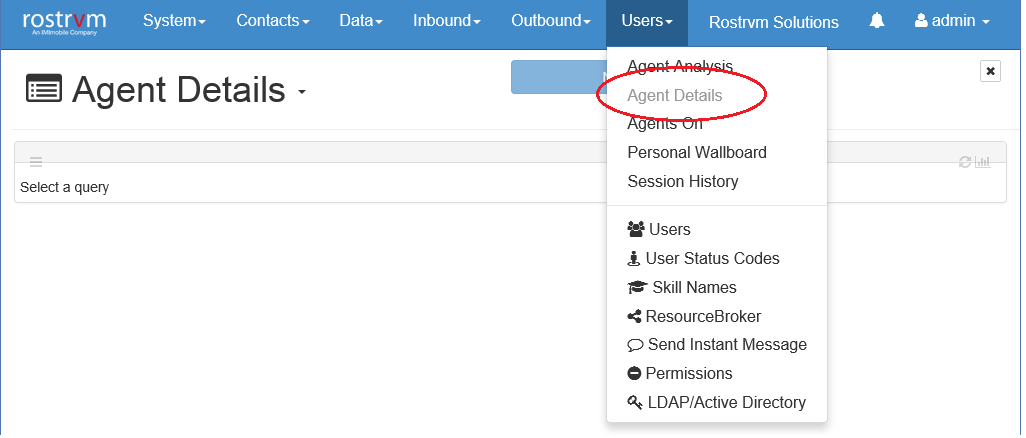
Click the Save button to complete the new report creation. Our new report appears under the Users menu as we have specified. To navigate to it select Agent Details from the User drop-down menu:
Our empty report is shown with a single panel which currently has no name and has no data, with a single fixed parameter box set to Now.
Creating a customised query
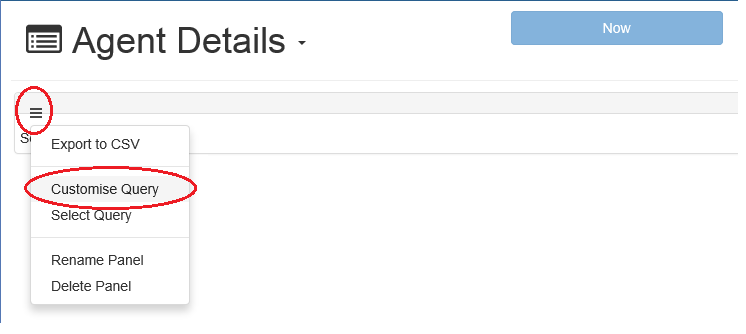
You can now add some data to the panel by selecting Customise query from the Panel Options menu:
A Confirm Changes to Report confirmation dialog is displayed. Click the Continue button to proceed. The query editor screen is displayed:
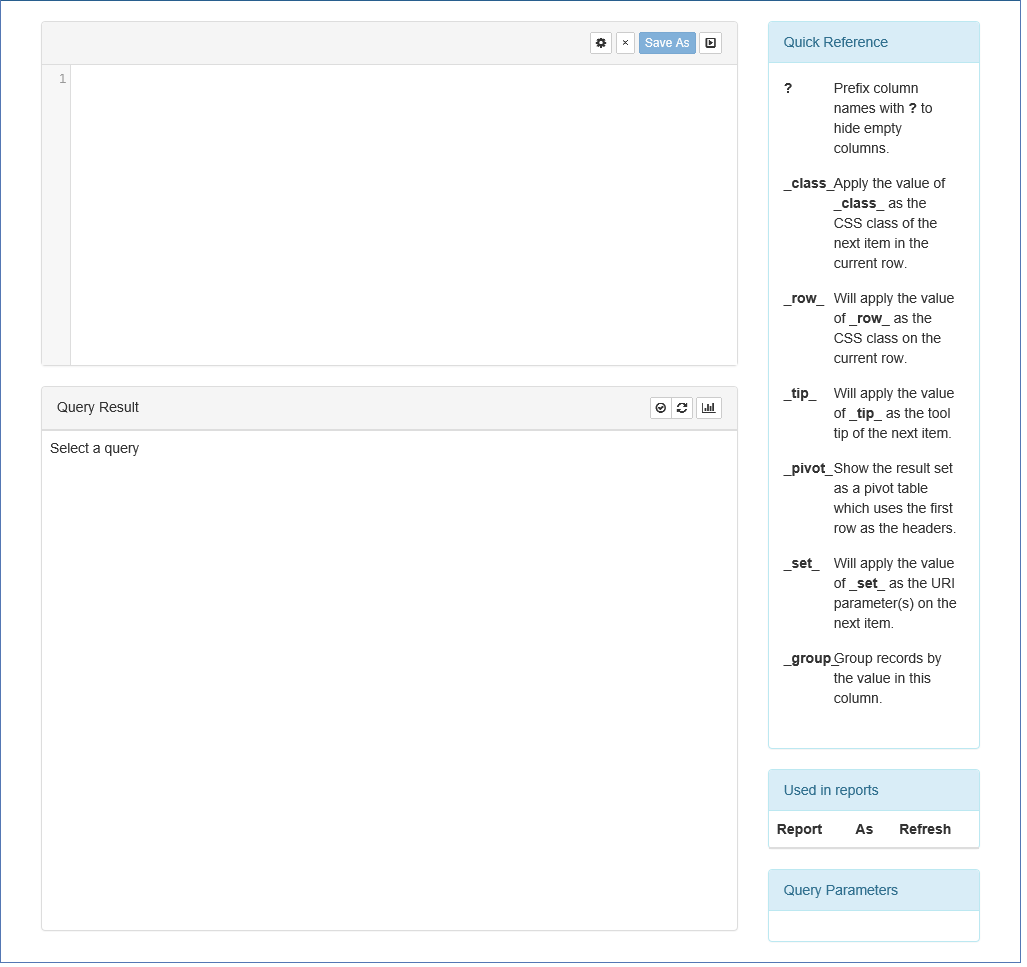
This editor screen is split into a number of panes.
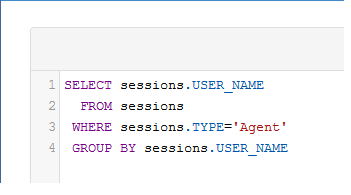
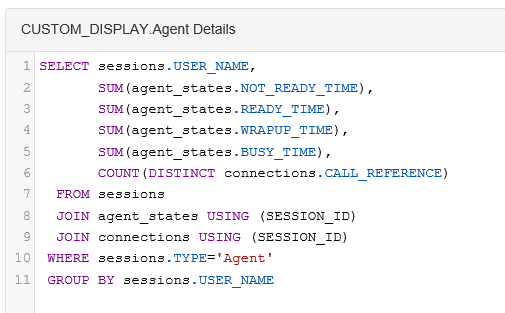
Initially we will concentrate on the Query Input pane as we begin building up our SQL query to extract our required agent details. Let us start with simply selecting a list of all agent sessions that we have ever had, and display them one for each unique user. This data can be extracted from the SESSIONS table as follows:
Before we save this query we can test it by committing the SQL. To do this click the Run Query button on the Query Result pane:
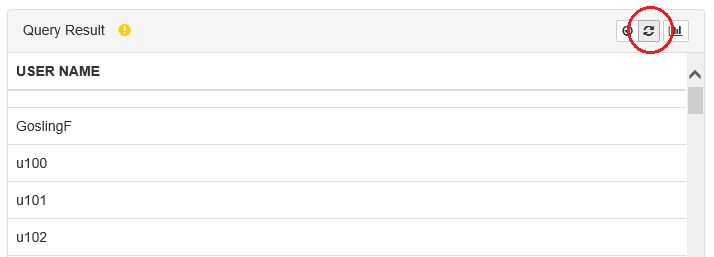
If the query is invalid then a dialog is displayed to indicating the error. if the query is ok the results of the query are shown in the panel display area.
We can now save our SQL as a new custom query. This is done by clicking the Save As button from the query input pane. The settings dialog is displayed so that you can enter a name for the query:
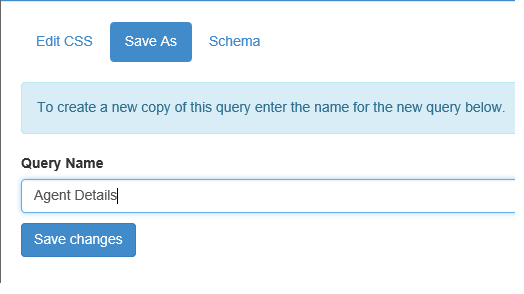
Click the Save changes button to save the query. Control is returned to the query editor and our new query is automatically assigned to the panel, and the panel name is set to the query name. This can be changed to be something different if required (from the panel menu) but it is advisable to leave it the same (i.e. it is more obvious if the Panel name is the same as the name of the query it contains).
Assigning a query to a panel
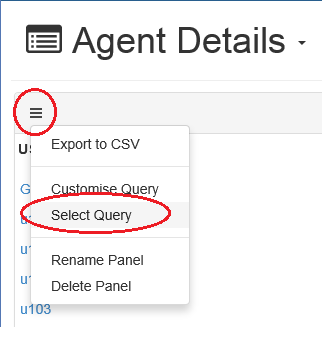
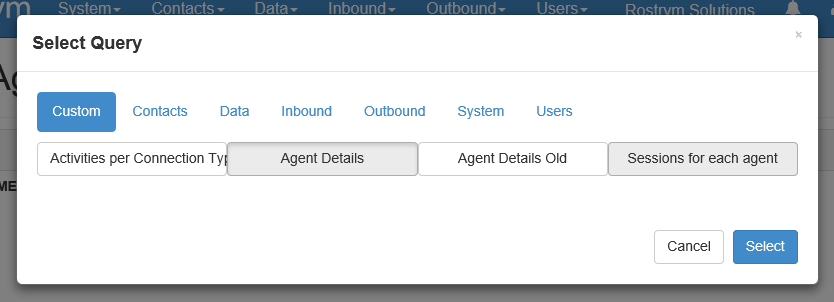
Our newly created query is already assigned to our single panel. If you wish to change this to a different query, or if you wish to assign this query to a different panel, you can do this by selecting the Select Query option from the panel menu:
The Select Query dialog is displayed showing all the Standard and Custom queries. From the Custom tag and our newly created query is listed. You can assign an alternative query to the panel by highlighting it and then clicking the Select button:
Adding data to our query
Now we have created a custom report, defined our query, and added it to our display panel, let us consider adding more data to the report. Let us add the individual agent state times for each user / agent (this information can be extracted from the AGENT_STATES table). We can also add the number of calls handled by each agent by looking in the CONNECTIONS table. Return to the query editor by selecting Customise query from the Panel menu and adjust the query as follows:
Click the Save button and then the Exit button to return to the report display which now shows our extended data:
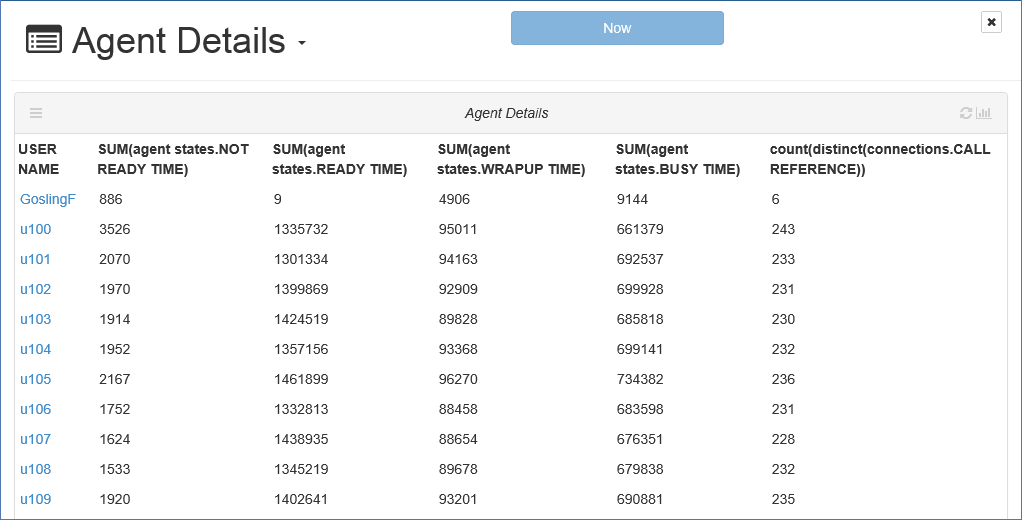
The data shows for each user the time spent in each agent state and the number of calls they handled for all users and for all sessions. This is OK but the format is a bit messy and hence we may want to tidy it up a little.
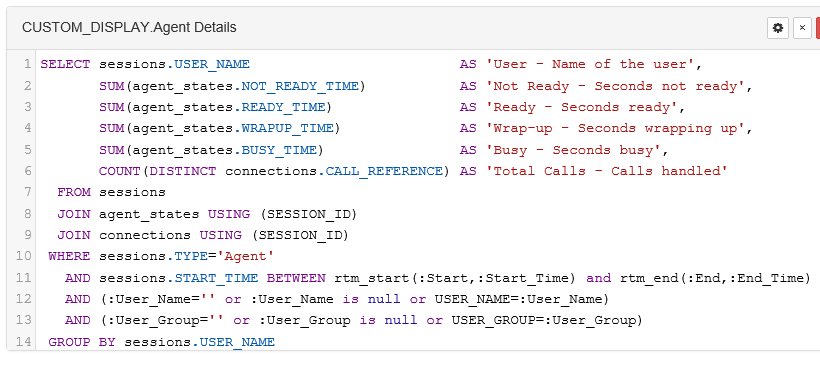
Changing the column names
One way to improve the look of the report is to change the column names to something more presentable (by default they simply reflect the SQL query) and providing tool tips for each header. This is achieved by editing the SQL query. Return to the query editor by selecting Customise query from the Panel menu and adjust the query as follows:
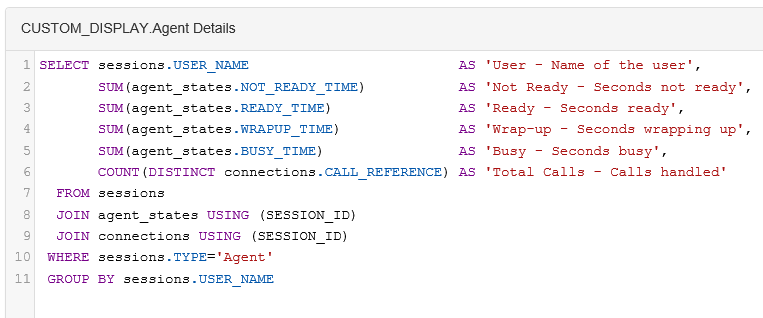
Click the Save button and then the Exit button to return to the report display which now shows our new column headers:
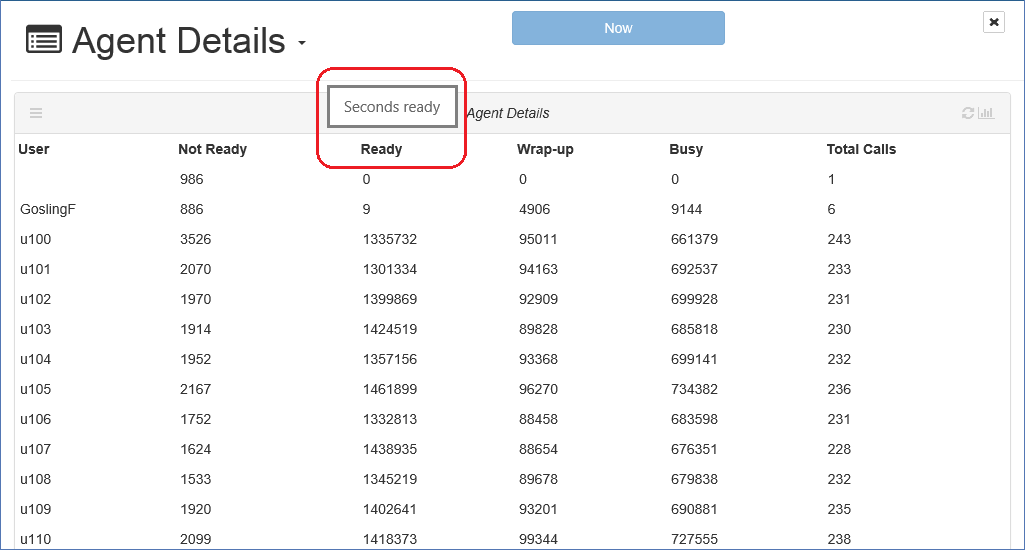
Hovering over a column header will display the tool tip.
Adding parameters
By default our report has one fixed parameter (i.e. Now) which means all agents for all time are displayed. It is more likely that we want to see the data for a particular day or date/time range, and a for a particular user group or even a single user. Once again, this is achieved by customising the query. Return to the query editor by selecting Customise query from the Panel menu and adjust the query as follows:
The keywords beginning with ':' indicate configurable parameters (in this case :User_Name, :User_Group, and the :Start & :End dates and time). The presence of these in the query automatically adds the appropriate parameter box to the report as follows:
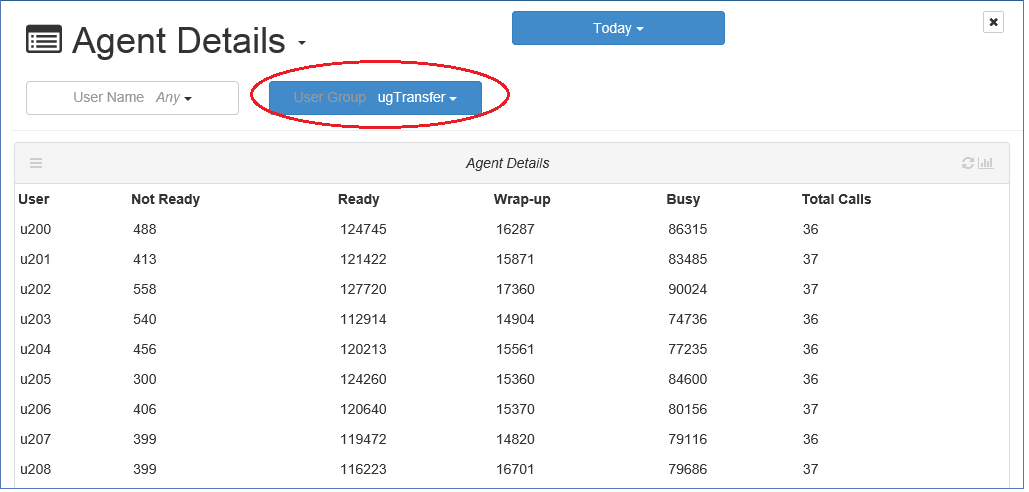
We now have 3 parameter boxes which can be set appropriately to filter down the resulting display data. All are rostrvm pre-reserved parameters and hence are manipulated as drop-down menus. If a non-reserved parameter is added to the SQL query then the box will appear as a free-format text box. Note that the date and time parameter box defaults to today, but can be changed to any date / time range, as well as the specific pre-reserved values.
These pre-defined parameter keywords can also be used to create a drop-down menu that allows multiple selects. A parameter (e.g. :User_Name) is replaced with a single value (e.g. 'FredBloggs'). A double colon value (e.g. ::User) is replaced with a list of values (e.g. 'FredBloggs','BertSmith'). This makes it suitable for use in a SQL IN expression. So if we wanted to convert our example above to allow multiple users to be selected then the following SQL change could be made:
"... or USER_NAME=:User_Name)"
to ...
"... or USER_NAME IN (::User_Name))"
Where a parameter has multiple values the single colon version will only substitute the first value. This means that care must be take using this mechanism with mixed panels.
Pre-reserved parameter keywords
The following pre-reserved parameter keywords exists for use in SQL queries ...
:Start
:Start_Time
:End
:End_Time
:User_Group
:Activity
:Call_Class
:Campaign
:Agent_Group
:Customer_Number
:AccountRef
:User_Name
:Type
:Category
:Call
:State
:Outcome
:Answer_Status
:Search
:Queue
:List
:Campaign_Status
There are other keywords that you may come across in the default displays and SQL queries, but these have special meanings and should only be used after consultation with Rostrvm Solutions Ltd.
Using the Quick Reference Keywords
The pane on the right contains some of the more rostrvm specific column display keywords that can be incorporated into your SQL query to format the output. These include:
_class_ Apply the value of _class_ as the CSS class of the next item in the current row;
_row_ Will apply the value of _row_ as the CSS class on the current row;
_tip_ Will apply the value of _tip_ as the tool tip of the next item;
_pivot_ Show the result set as a pivot table which uses the first row as the headers;
_set_ Will apply the value of _set_ as the URI parameter(s) on the next item;
_group_ Group records by the value in this column.
The following section show examples of their use.
Using the _class_ keyword
It would look better if the durations in our custom report were shown in hours, minutes and seconds. Also we may wish to display our agent state data so that each column background matches the default agent state reports. This can be done using some pre-defined database functions, CSS classes and the _class_ keyword as follows:
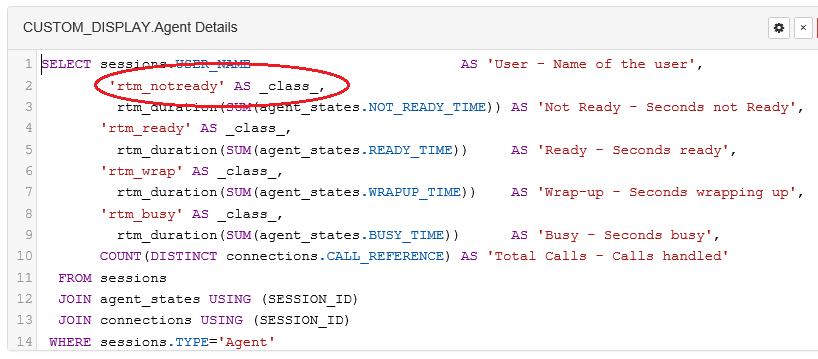
For each of the 4 agent state columns, the statement applies the value of _class_ (in this case each our pre-defined CSS class names) as the CSS class of the next item in the current row. The pre-defined database function rtm_duration formats the times (a full list of pre-defined database functions is defined here). If we now return to our report it now looks as follows:
For a full list of the rostrvm pre-defined CSS classes is given here.
Using the _tip_ keyword
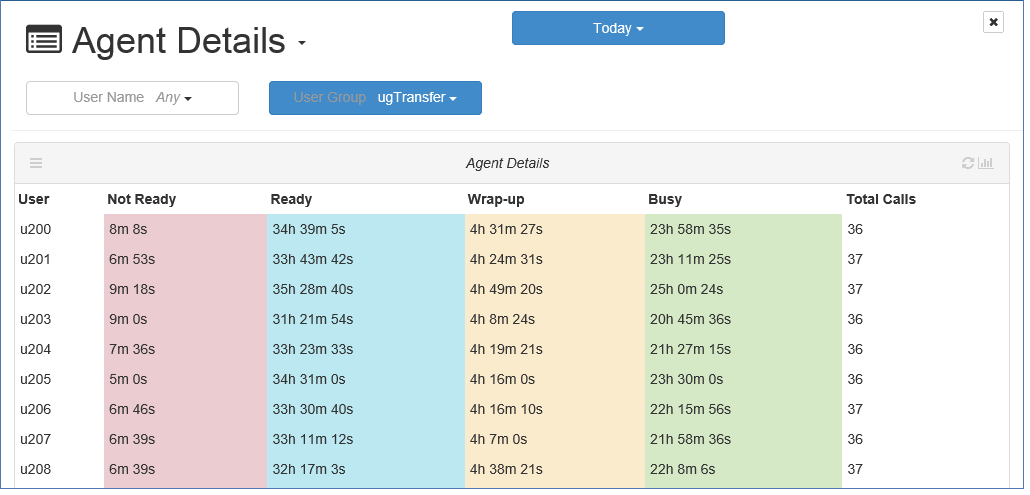
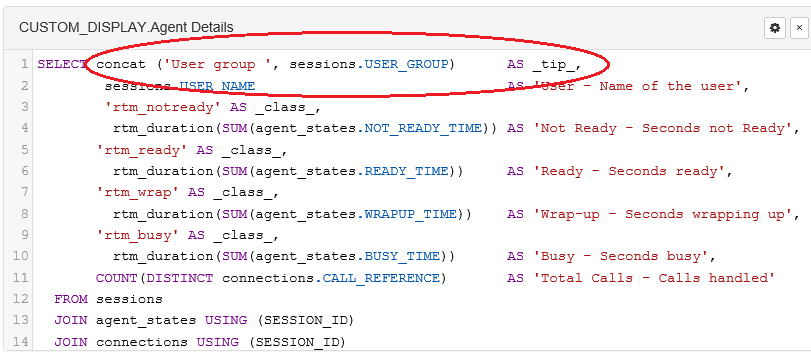
There are two types of display tool tips, the tool tip for each column header, and a tool tip for the column data itself. Our report has column header tips for each of our columns. Suppose we now want to show a tip on the data itself. So for example let us add a tip on the username to show the user group to which the user belongs. This can be achieved using the _tip_ keyword as follows:
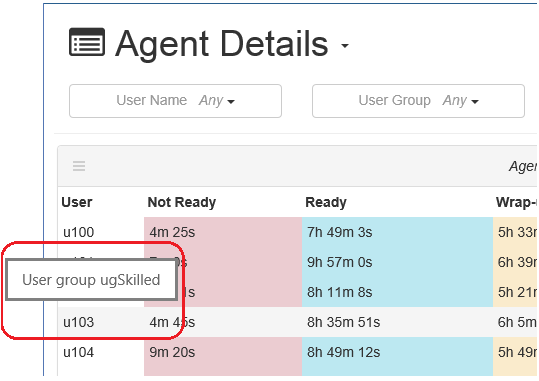
If we now return to our report and hover the cursor over one of the users the name of the user group to which they belong is shown as the tool tip:
Using the _row_ keyword
In a similar way that we can apply CSS formatting to a specific column using the _class_ keyword, we can apply CSS formatting to a whole row using the _row_ keyword. So for example if we want to highlight how many agents have spent more than 10 minutes in Wrap-up we can do so as follows:
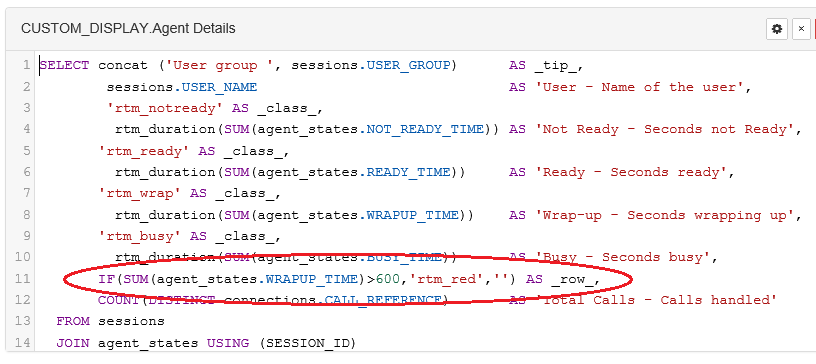
If we now return to our report we can see clearly that user u102 has spent over 10 minutes in wrap-up already:
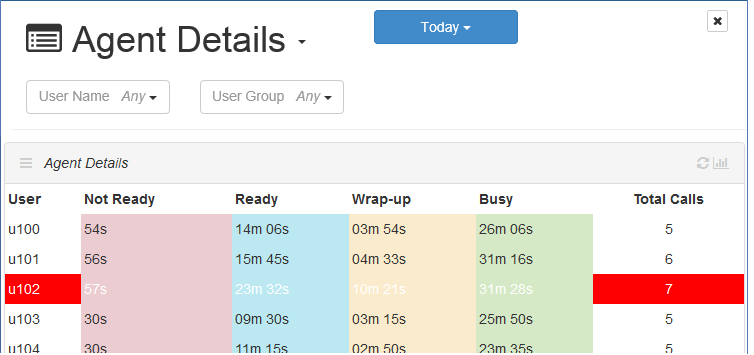
Note that only the columns that do not have column CSS styles applied for row are highlighted (i.e. column CSS styles take precedence over row CSS styles).
Using the _pivot_ keyword
The _pivot_ keyword is useful for formatting a list of rows, with repeated data in the first column, into a more easy to read table. It effectively takes a chosen column of data and presents it as a single header row, and then takes the next column of data and puts each cell of data under the appropriate header. This is best understood by looking at an example.
Consider a new SQL query panel, and assign it to a new report to show for each type of call the number of each business outcome that was set:
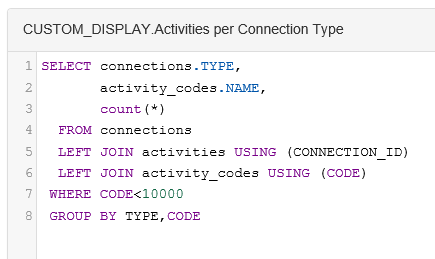
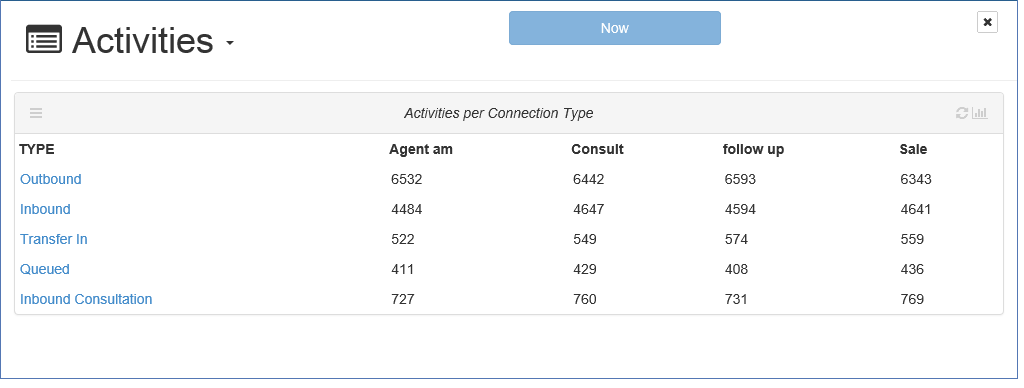
This gives us the information that we require but not in a particularly easy to read format:
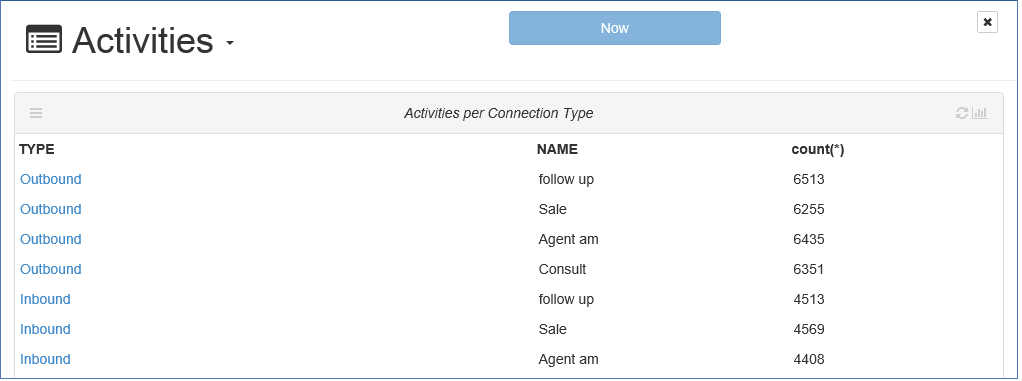
The report would look better if we we can move the NAMEs in column 2 to a header row and then display the data in column 3 as a table. This can be achieved by pivot'ing the second and third rows as follows:
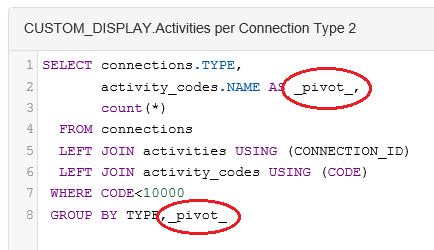
Now the report is much more presentable:
Using the _set_ keyword
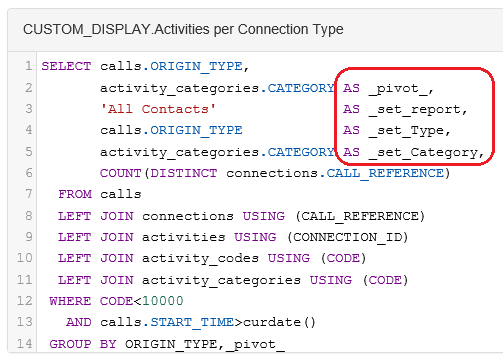
The _set_ keyword allows links to other reports to be defined, and for parameters passed into that linked report. For example with our new report we may want to click on the numbers displayed and look at the individual contacts represented by that value. To do this we want to link to the All Contacts report and fill in the parameters Type (calls.ORIGIN_TYPE) and Category (activity_categories.CATEGORY). This means changing our report slightly to show the calls origin type (rather than the connection type), and the category (rather than the activity code) and then adding the appropriate _set_ commands:
This results in a similar report to before but with links to the All Contacts report as follows:
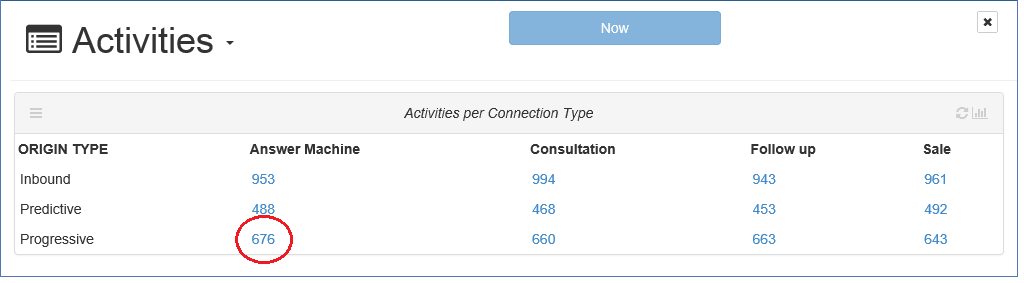
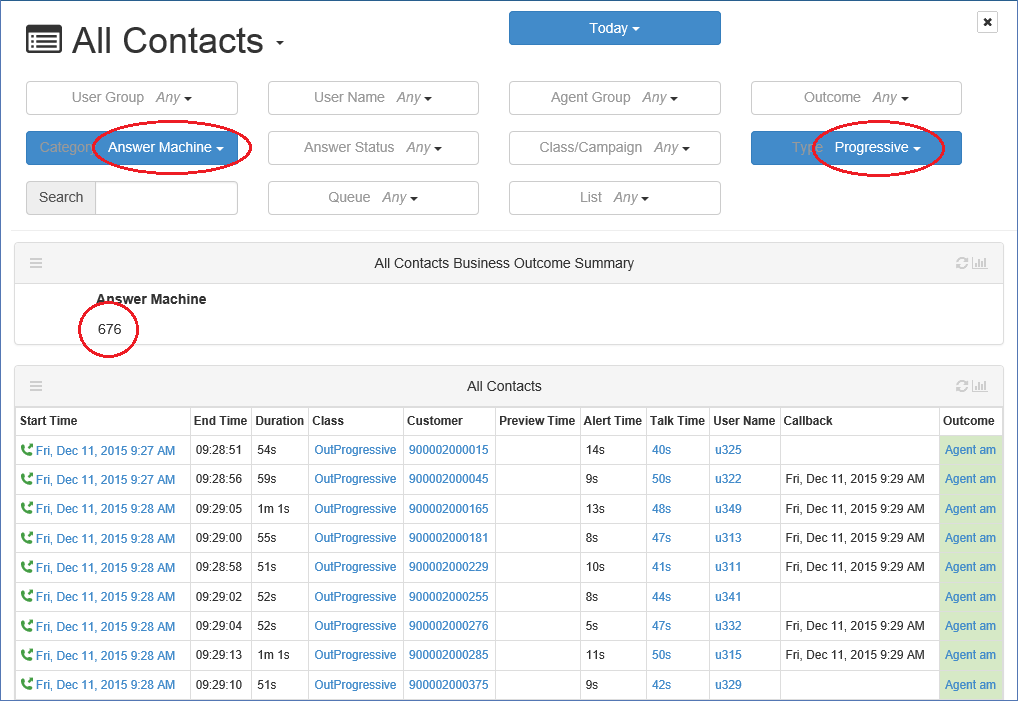
We can now look at all the Progressive calls that resulted in an outcome of Answer Machine by clicking the appropriate value as circled above. The All Contacts report is shown with the appropriate parameters set.
Using the _group_ keyword
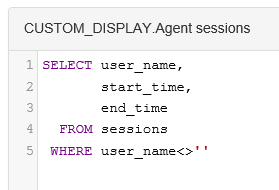
It is possible to group rows of data together using the _group_ keyword. So for example, if we create a report that lists all the sessions for all users then it would be more readable if the rows were grouped by the user name. So before adding the _group_ keyword let us create a simple report that shows all sessions for all users as follows:
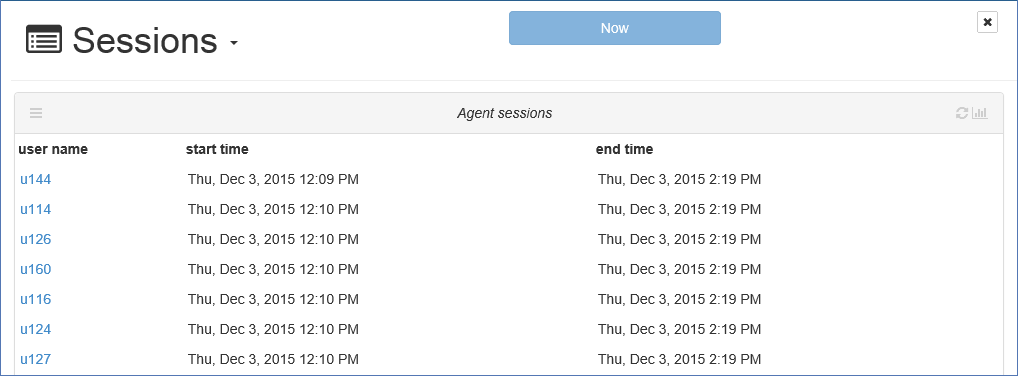
The resultant report is as follows:
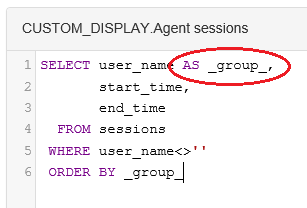
We can improve the report by grouping the rows for each user as follows:
This changes the format of the report to:
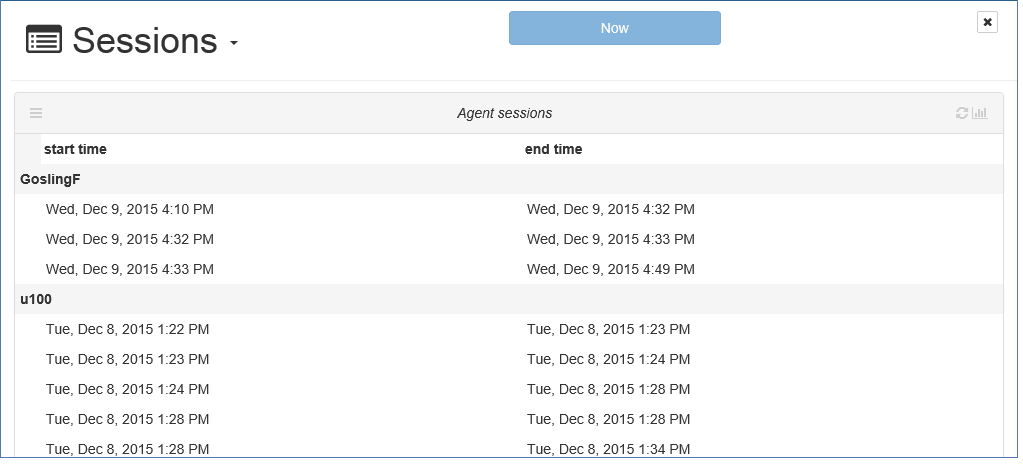
The USER NAME column is replaced by a group header row for each user.
Other Column Keywords
As well as the column keywords described above others are available for more advanced formatting of reports. These are as follows:
| _hide_ | Hide this column (this can be used for sorting/grouping rows in a query without displaying the results); |
| _sortval_ | When you click on a column heading in a report the column is used to order the rows. If the values in the column contain data that is not alphabetically/numerically sortable (e.g. Mon, Tue, Wed, Thur) a _sortval_ column may precede it with the value to use for the ordering (e.g. the day number); |
| _perm_ | Only display the next column if the user has the particular permission; |
| _href_ | Contains a URL link to apply to the next column - clicking the column value will take you to that URL; |
| _target_ | Specifies a target window for clicks on the next column (e.g. to open a new window for a link); |
| _menulink_xxx | The next column should be a link to the XXX object. For example: SELECT USER_NAME _menulink_User_Name,AGENT_ID FROM USER_DETAILS will show a list of agent id's but will provide the user name context menu on that column; |
_report_ Next column links to the manager report named in this column;
_bar_ This column will be displayed as a bar chart.
Infinite Scrolling
Some displays may return thousands of rows. This being the case it can take quite a long time for the data to be populated and displayed in the report panel. It is therefore possible to change the last panel on any report to have infinite scrolling. This allows data to be displayed on the report in chunks rather than reading in all the data and then displaying it in one hit. A configurable number of rows are initially read and displayed, so that when you scroll down to the bottom of the panel the next set of data is read and displayed. When you reach the bottom of the display it shows that more data is available and is being read in. This continues until all data is read.
To add infinite scrolling to the last panel of a report simply insert these lines at the end of the SQL:
LIMIT 100
OFFSET $offset
where 100 is the number of lines that are read in each time.
Examples of default reports where the last panel has infinite scrolling include:
| • | Contact History |
| • | Account Contact History |
| • | Agent Callbacks |
| • | Do Not Call |
| • | List Accounts |
| • | List Outcomes |
| • | Audit Trail |
Building more complex Queries and Displays
By using and combining these column keywords, database functions, CSS classes, and more complex SQL, we could continue building our display(s) and further customise them to meet our requirements. Rather than documenting further examples of how to do this here it is recommended that you look at the existing default displays (or other custom reports) using the Customise query option from the Panel menu of each panel on each display. These will give you a much wider range of SQL usage and a much better idea of how to create more complex SQL queries and Manager displays.