There are a number of functions provided to aid in tracking down some of the problems which may be happening on your rostrvm system. These functions, if misused, can impact the rostrvm service and should only be invoked with instruction and assistance from Rostrvm Solutions Ltd. They are mentioned here briefly so that the system manager is aware of their existence, rather than as detailed instructions on how they can be used.
Component debug messages
Each component can log debug messages to the standard rostrvm log and trace files in order to provide additional information to rostrvm Solutions Ltd when investigating a problem with the system. These messages cannot be viewed through the System control Log Viewer and are output to the files only.
The type of debug information logged is specific to each component, although some is common for them all. For this type of information to be logged the severity level on the process also needs to be set to Debug.
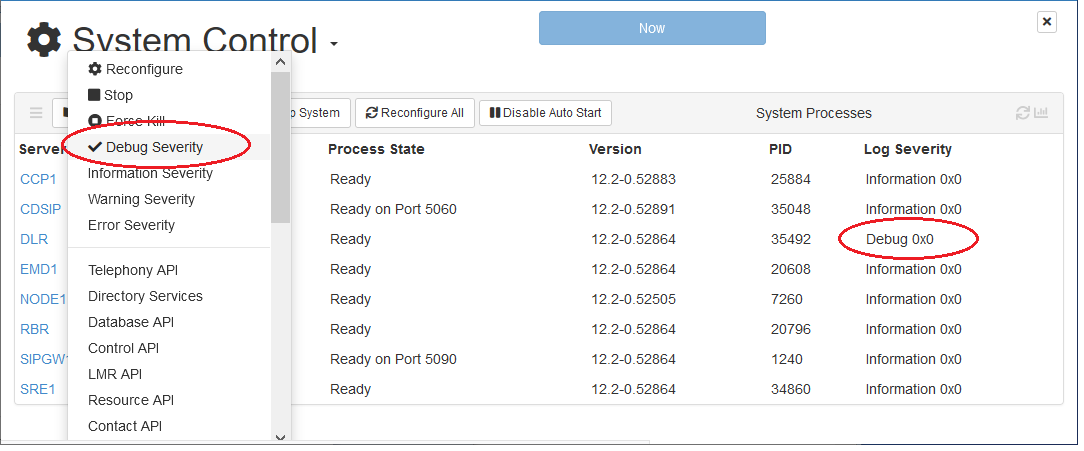
Default debug log messages will subsequently be output to the log for the selected component.
To output additional context information
To dump context information, select the component, left-click, and from the drop-down menu select the desired option. In the example shown below, the devices context of the Invex (CDSIP) component is being requested.
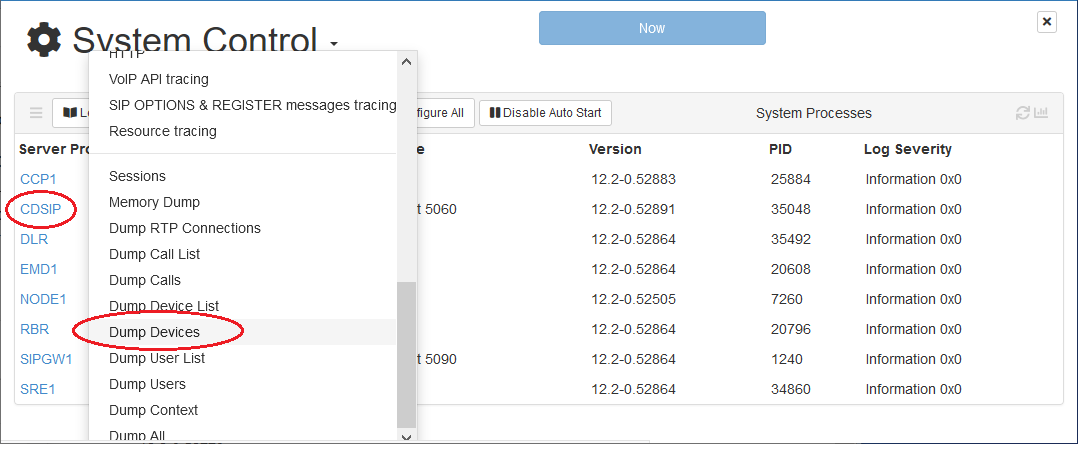
Any information relating to the dump request can be viewed in the Log Viewer window, the appropriate log/trace file, and on a new tab in the browser.
rostrvm message event tracing
It is possible to trace the rostrvm messages being transmitted between processes. This facility is a useful aid when tracking down an anomaly such as a service being requested by a client that is not being actioned correctly.
Some event tracing is always enabled and cannot be disabled. Additional tracing can be started and stopped as and when required.
From System Control, select the component, left-click, and from the drop-down menu select the desired option. In the example shown below, database query tracing has been enabled on the Invex (CDSIP) component .
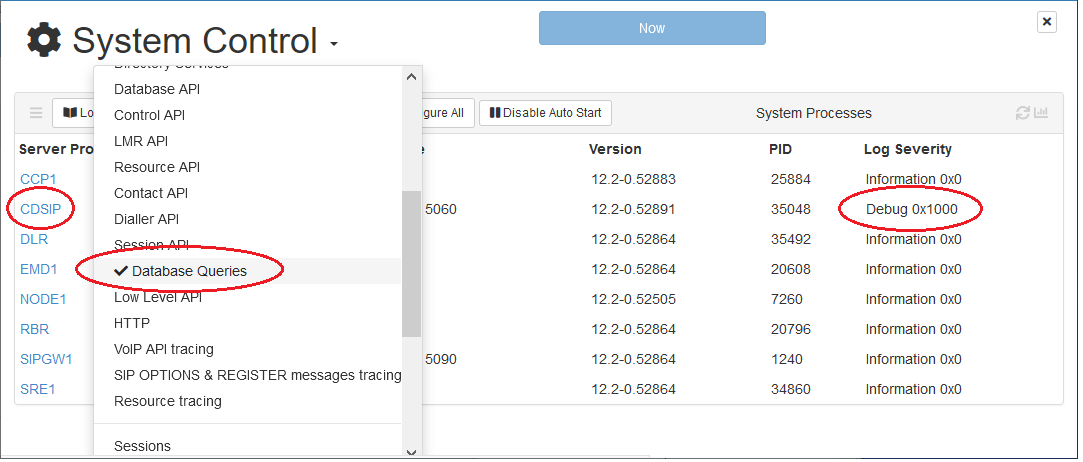
To switch the additional tracing off, simply unselect the desired option.